E-readiness in Kenya 2006
Staging Results & Key Findings
An interesting finding of the study was that the 25 higher education institutions surveyed had a total enrolment of 170,000 students. This was over 50% higher than the enrolment data in the Kenyan Economic Survey 2006. The 17 universities had a total enrolment of 130,000 students, 20,000 in private universities and 110,000 in seven public universities. This was markedly higher than the 89,000 students indicated in the Economic Survey 2006, which was used to calculate the initial sample sizes. The 130,000 students did not include the enrolment in the tertiary colleges that are offering degrees in partnership with the public universities (e.g., Kenya College of Accountancy, Augustana Academy, etc.).
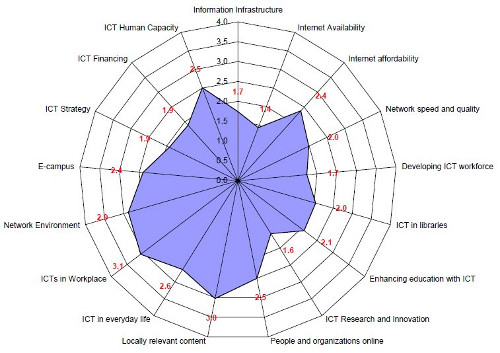
Average indicator stages for all institutions
The results show that on average most institutions are in stage 2 and below in all the network access and networked campus categories of indicators. For example, Internet availability is only in stage 1.4 suggesting that overall the institutions are not ready to use ICT for e-learning. The score of 2.4 in Internet affordability means about 50% can afford to double their Internet bandwidth costs if only they considered Internet access a strategic priority.
The score of 2.0 and below in ICT strategy and ICT financing means that ICT is not yet a strategic priority for the higher education institutions. Consequently, the profile of heads of ICT is low and budget allocation for Internet bandwidth is less than 0.5% of the operational budgets.
Most of the institutions were not using ICT for learning (stage 2.1 in enhancing education with ICT and stage 2.0 for ICTs in libraries). This again is related to the ICT strategy that is often not aligned to the educational goals of the institutions. The institutions are below stage 2.0 in ICT research and innovations measured using quality of ICT-based projects and graduate studies in ICTs. For example, only University of Nairobi has an operational doctoral program in the non-engineering ICT degree programs (i.e. information systems and computer science).
The results also show that universities have not yet started integrating ICT into their curriculum. Students are also not required to use Internet resources for learning for the majority of university courses. A few institutions have installed course management software like Moodle, WeBCT or Blackboard and faculty are using them to supplement their classroom teaching but none of the institutions had data on the percentage of courses that are using the e-learning platform.
Overall, however, the higher education community exhibited a high readiness for using ICT as shown by the relatively higher stages in networked society category of indicators (see Figure 5.1). For example, institutions are in stage 3 in locally relevant content and in stage 2.6 in ICT in everyday life indicator. This is despite the fact that about 49% of students access computers and Internet from cyber cafes and only 11% access computers from their institutional campus networks (see Figure 4.2.). Moreover, about 95% prefer to use international Web-based e-mail (Yahoo, Gmail, and Hotmail) rather than the unreliable institutional e-mail.

Location of primary access to computers by users in HE institutions
Networked Society and Gender
This study also conducted a gender analysis of some of the networked society sub-indicators that measure ICT usage and access. These sub-indicators include location of access to computers and Internet, the purpose of using computers, frequency of access to websites, and regular visit to local Web portals. The results show that there is no significant difference in ICT usage by male and female students, and faculty. In fact, a higher percentage of female users access computers, the Internet and ICT at cyber cafes (48%) compared to 42% male users. In terms of regular usage of Internet, male students are marginally more intense users of the Internet. For example, 30% of female respondents do not visit any local websites compared to 21% of male respondents who do not visit local websites. The results also show that 30% of the female student respondents reported that they use the Internet daily in contrast to 35% of the male students who reported to use the Internet daily. However, the percent of female and male students using the Internet, at least 3 days per week, is similar for male and female students.
The research results also show that students in the humanities and languages use the Internet more than students in engineering, biological and physical science, and medical sciences. Although the research study did not analyze the gender enrollment in different programs, generally there are fewer female students in engineering and science degree programs. This may explain why female students constitute 30 to 40% of the enrollment in public universities but over 50% in private universities. In terms of ICTs in the workplace, the research did not find any difference in the usage and access levels of female and male faculty members and staff.
Internal vs. external factors of e-readiness of higher education institutions
In general, universities were at slightly higher stages in all of the 17 indicators when compared to the eight tertiary institutions surveyed as Figure 5.2 shows. This means that the institutional challenges of all the institutions are similar. We note that only a few of the 17 indicators are directly influenced by the external economic and ICT environmental factors. For example, Internet availability is partly due to the fact that Internet bandwidth costs are relatively high in Kenya at $2,330 per Mb/s per month. The network environment indicator measures the availability of ICT power supply backup, critical in Kenya where the commercial power supply is not reliable. Thus, only three of the 17 indicators depend directly on the external ICT environment (Internet availability, Internet affordability, network environment). The stages of the other 14 indicators depend on institutional ICT decisions and strategies rather than external factors.
As an example of the impact of institutional ICT strategy indicator on overall performance in other indicators, United States International University (USIU), Strathmore University and University of Nairobi were in stage 3 and above in at least 50% of the indicators. The only difference was that the institutional leadership, particularly vice chancellors, championed ICT within the institutions. This was a significant finding as the heads of institutions matter more than the few external factors affecting ICT diffusion in Kenya.

Comparison of stages for universities and tertiary institutions
Strategic ICT sub-indicators
This study calculated the values of 60 sub-indicators (e.g. personal computers (PCs) per 100 students, Internet bandwidth per 1000 students). The values were then converted to stages using the staging framework developed by the researchers. The survey selected a subset of only 15 sub-indicators that were considered strategic. These strategic sub-indicators could, for example, be incorporated in the performance targets of the institutions and therefore monitored on an annual basis. Figure 5.5 shows the overall performance in the 15 sub-indicators for the 25 institutions. It is clear that institutions are in stage 1 in Internet bandwidth per 1000 students. In real terms, this means that institutions are purchasing less than 512 kb/s per 1000 of downlink bandwidth and less than 128 kb/s per 1000 students of uplink bandwidth. This is unacceptably low and it is not surprising that students and faculty are dissatisfied with the speed. Similarly the institutions are in stage 1.8 (below 2.0) and therefore have fewer than 3 PCs per 100 students. In order to be ready to use ICT to enhance learning, it will be necessary for the institutions to move to at least stage 3 in all the strategic indicators.

Average stages for 15 strategic indicators for all institutions
Summary conclusions, critical issues and recommendations
The main conclusion of this survey is that the higher education community, especially the university community in Kenya, is ready to use ICT for learning, teaching, research and management. However, the institutional leadership does not yet consider ICT a strategic priority for their institutions. Consequently, institutions are allocating low operational budgets to ICT, have not invested adequately in campus networks, and are not giving attention to the use of ICT to enhance education and research.
A stakeholders' meeting of the heads of institutions and ICT directors in March 2007 discussed the findings of the survey and concluded that each institution needed to understand the results in detail. They proposed that the research team should help the institutions incorporate strategic sub-indicators into their ICT and corporate strategies. That is, dissemination of results should happen at each individual institution. This was outside the scope of the current research project and additional funding will be required for dissemination. This report will also be converted into a policy brief that will be launched at a stakeholders' meeting of donors, government officials, the private sector as well as university faculty and managers.